

The following is a curated and reviewed list of the top statistics around Project Management as of February 2024.
Contents
Top Project Management Statistics
Here are the top project management statistics that should grab your interest.
23% (1 in 4) use a Project Management software.
77% of high-performing projects use Project Management software.
54% cannot track real-time project KPIs.
47% of Agile developments are late, have budget overruns, or result in unhappy customers.
77% of high-maturity organisations meet goals, compared to 63% of others.
11.4% of investment is wasted due to poor project performance on average.
61% of projects have highly evolved sponsors.
47% of project managers believe they are expected to deliver more value with a reduced budget and timeline.
37% of projects fail due to a lack of clear goals.
50% reduction in delivery time, 75% fewer defects, and 34% lower productivity are reported by Agile teams that aggressively control Work in Progress (WiP).


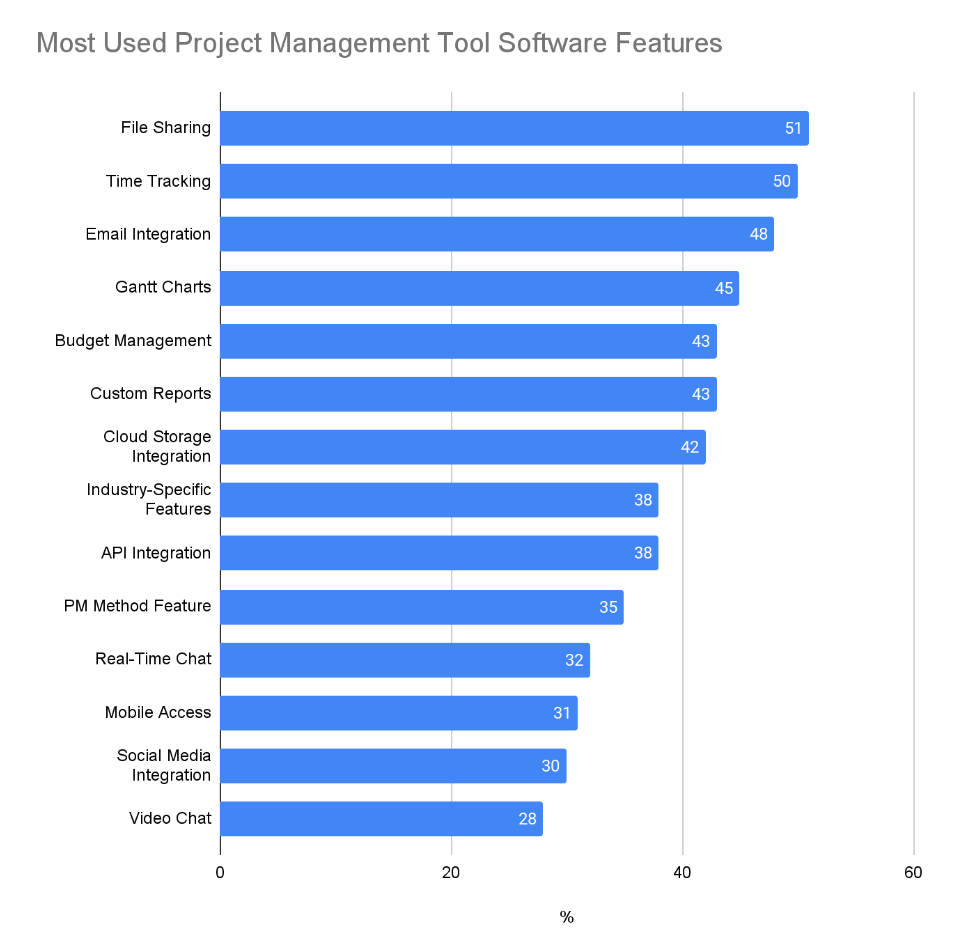
Project Management Tools
Here are the top project management statistics about tools that should grab your interest:
22% of organisations use project management software (TeamStage).
77% of high-performing projects use project management software (TeamStage).
54% of companies cannot track real-time project KPIs (ProofHub).
41.96% of organisations use Jira for project management (FounderJar).
71% of project management professionals report increased use of collaboration software in the past year (Visual Planning).
54% of the workforce believes automation tools could save them more than five hours per week (ProofHub).
56% of organizations find new project management software costs too high (ProofHub).
47% of Agile projects are late, have budget overruns, or result in unhappy customers (Visual Planning).
77% of high-performing teams use project management software that offers a wide variety of features (ProofHub).
Project Management Best Practices
What can we learn about best practices in project management?
1/3 spend 1 or more days manually collating project reports.
52% of projects have a scoping document, and 58% follow a defined methodology.
64% of project managers engage in risk management.
61% mostly or always apply a defined project methodology
61% Mostly or always create a scoping document
50% Mostly or always baseline their project schedules
60% of Project managers always or mostly engage in risk management

Project Time & Resource Allocation
Statistics that tell us more about how project managers spend their time and manage resources.
68% of project managers' time is spent on formal projects and 23% on informal projects.
25% report not having the right technology to enable team collaboration on informal projects
50% of projects fail to deliver on time, and 23% cite poor resource allocation as the primary cause. (PMI, 2022 Pulse of the Profession® report)
36% of companies use resource management to estimate and allocate resources often.
75% of project managers say they have been asked to do too much work with too few resources. (PMI, 2021 Project Management Salary Survey)
20% of the average project manager’s time is spent on resource allocation.
73% more mistakes are likely to be made by overallocated resources.
50% more resources are likely to leave their jobs when underallocated.
Organisation Maturity
Statistics that delve into the maturity of an organisation’s project management.
45% are dissatisfied with their organisation's current level of project management maturity.
82% of organizations have at least one PMO.
45% say their organization has a track record of project success.
53% of organizations prioritize building a culture receptive to change.
70% prioritize culture centred on delivering customer value.
69% say senior leadership highly values project management.
1 in 5 are unsure what is being used to measure business value.
Project Outcomes
How often do projects succeed, and what conclusions we can draw?
34% of organisations complete projects on time,
36% deliver full project benefits
34% of projects are completed on budget
29% of organisations mostly or always complete projects on time.
43% mostly or always complete projects on budget
40% of organisations believe they deliver the full benefits of their projects
67% more project failures are reported by organisations that undervalue project management.
67% of high-maturity organisations deliver on time, as opposed to 30% of others.
56% of high-maturity organisations stay within budget, while only 21% of others do the same.
35% of organisations consider organisational agility as a top factor in achieving future success.
32% of organisations prioritise choosing the right technologies for success.
31% of organisations emphasise securing relevant skills for success.
Small Projects (less than $1 million) | Large Projects (more than $10 million) |
76% are successfully | 10% are successful |
20% are challenged | 52% are challenged |
4% fail | 38% fail |
Future Trends
These statistics outline the future of project management.
62% believe project work will increase in the future.
71% believe people will need more project management skills in the future.
2.3 million people will be needed each year to fill all project management-oriented positions expected to open by 2030.
49% will invest in technology advancements in the next 3-5 years.
44% will invest in digitalization in the next 3-5 years.
40% of project workers say they might leave their jobs in the near future
27% of IT departments will consider a hiring freeze to insulate themselves from economic downturns.
Training & Development
How much time do organisations spend on project management training? Read on. Power skills, often called soft skills, are interpersonal and emotional intelligence attributes that enable individuals to communicate, collaborate, and navigate complex situations effectively.
92% of respondents agree that power skills help them work smarter.
Organizations spend 51% of their training budget on technical and 25% on power skills.
Project professionals spend 46% of training time on technical skills and 29% on power skills.
47% say power skills were not discussed when hired or promoted.
12% say their organization does not measure power skills in individuals.
20% say their organization does not measure power skills in teams.
Wasted investment due to poor project performance averages 4.8% for organizations prioritizing power skills versus 8.8% for those that don't.
65% of organizations prioritizing power skills successfully meet business goals versus 25% of those that don't.
Organizations prioritize developing leadership (65%), technical (68%), business (58%), and digital skills (50%).
59% use design thinking at least some of the time.
61% provide project management training.
51% require project role certification.
Agile Development
An exploration of statistics relating to the Agile Development approach.
52% prioritise Agile practices for accelerating time to Market.
47% of Agile teams are measured by on-time delivery.
70% of agile organisations increase their time-to-market
36% of product owners adopt Agile practices
4 out of 5 organisations have Agile teams distributed geographically.
27% of Agile users are in the technology industry
2:1 difference in throughput between 95% or more dedicated teams compared with 50% or less dedicated teams.
250% better quality is achieved by Agile Teams doing Full Scrum compared to teams doing no estimating.
40% less predictability, 17% lower quality, but 17% higher productivity characterise teams of 1 to 3 people.
14% higher productivity, 8% greater predictability, and 26% increased responsiveness are observed in teams with two-week sprints compared to those with four-week sprints, although quality is 5% lower.


Comments